


Most organizations already collect more operational data than they use. Applications write logs, infrastructure reports metrics, security tools raise alerts, cloud and SaaS providers publish service status, and business systems record every transaction. Yet when a disruption arrives, leaders often learn about it from a customer complaint, a social media post, or a call from a frustrated business unit. The signals were there. They were simply not connected to the services that matter, not interpreted in time, or not routed to someone with the authority to act.
Telemetry for proactive resilience means ingesting and analyzing real-time and near-real-time data across your environment to detect changes, identify emerging risks, and take preventive action before disruption escalates. This article explains what operational telemetry is, how to connect it to important business services and impact tolerances, and how to turn live signals into early insight that supports better decisions. It is written for operational resilience leaders, CIOs, and the risk and technology teams who support them.
Why this matters
Operational resilience programs are often built around plans, assessments, and annual tests. Those remain essential, but they describe what an organization intends to do and what it was able to do on a given day. They do not show whether an important business service is drifting toward failure right now. Telemetry closes that gap. It provides a continuous view of how services are actually performing, so that leaders can see degradation as it develops rather than after customers feel it.
Recognized frameworks increasingly expect this capability:
- ISO 22301:2019 requires organizations to determine what needs to be monitored and measured, how, and when, and to evaluate the performance and effectiveness of the business continuity management system (Clause 9.1, Monitoring, measurement, analysis and evaluation).
- The NIST Cybersecurity Framework (CSF) 2.0 includes a Detect function, described as enabling "the timely discovery and analysis of anomalies, indicators of compromise, and other potentially adverse events." Its Continuous Monitoring (DE.CM) and Adverse Event Analysis (DE.AE) categories describe how assets are monitored and how anomalies are analyzed.
- The EU Digital Operational Resilience Act (DORA) requires financial entities in scope to have mechanisms to promptly detect anomalous activities, including ICT network performance issues, with defined alert thresholds and criteria that trigger incident response (Article 10). Its incident management process must also put in place early warning indicators (Article 17).
- The UK Prudential Regulation Authority's SS1/21 expects firms to identify important business services and set impact tolerances for them. Knowing how close a service is to its tolerance during a disruption depends on timely information about that service.
The common thread is clear. Resilience is not only about recovering well. It is also about seeing trouble early enough to prevent it, contain it, or make a better decision while options are still open.
The business challenge
Few organizations lack data. The challenge is turning that data into timely, trusted insight about the services that matter. Common obstacles include:
- Signals are organized around technology, not services. Monitoring tools are usually configured by system, platform, or team. Few can answer a simple executive question: is our payments service, claims service, or customer onboarding service healthy right now?
- Alert fatigue hides what matters. When teams receive thousands of alerts, important early warnings are lost in the noise, and thresholds are often set to avoid false alarms rather than to give early notice.
- Third-party blind spots. Critical services increasingly run on cloud platforms, SaaS applications, and outsourced providers. Their health signals, status pages, and contractual reporting are rarely brought into the same view as internal telemetry.
- No link to risk appetite. Key risk indicators (KRIs) may be reported monthly in a risk register while operational metrics sit in engineering dashboards. The two are seldom connected, so early technical signs of risk never reach risk owners.
- Unclear ownership of action. Even when a signal is detected, it may not be clear who decides whether to fail over, invoke a continuity plan, notify a regulator, or communicate with customers.
- Data quality and coverage gaps. Missing logs, inconsistent time stamps, unmonitored legacy systems, and manual processes all limit what telemetry can reveal.
The result is an organization that is data-rich but insight-poor: it can explain an incident in detail after the fact, but struggles to see it coming.
Key concept: from signals to actionable intelligence
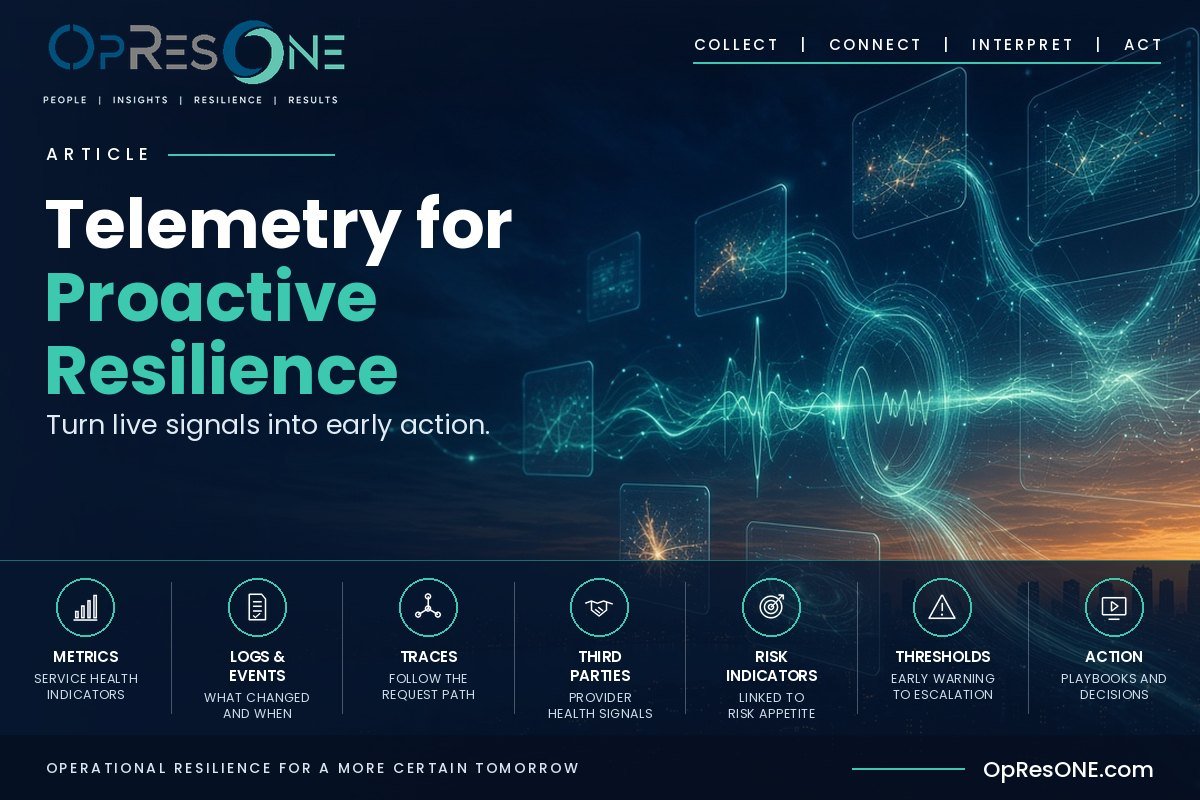
Telemetry becomes a resilience capability when it moves through four stages: collect, connect, interpret, and act.
1. Collect the right signals
Operational telemetry covers several kinds of data. The OpenTelemetry project, a widely used open-source observability framework, describes core signals including traces (the path of a request through an application), metrics (measurements captured at runtime), and logs (records of events). Resilience programs should also consider:
- Service-level indicators such as availability, latency, error rates, throughput, and capacity. Google's Site Reliability Engineering guidance calls latency, traffic, errors, and saturation the "four golden signals" of monitoring for user-facing systems.
- Security events from detection and response tools.
- Business and process signals such as transaction volumes, queue backlogs, failed payments, abandoned applications, or call center wait times.
- Third-party signals including provider status pages, service level reports, and notifications required by contract.
- Key risk indicators that track conditions such as unpatched critical vulnerabilities, overdue recovery tests, staff shortages in key roles, or concentration on a single provider.
The goal is not to collect everything. It is to collect what tells you whether important business services are healthy and whether their resilience is improving or eroding.
2. Connect signals to important business services
Raw signals become meaningful when they are mapped to the services they support. This builds directly on the service and dependency mapping that operational resilience programs already require. If you know which applications, data, infrastructure, people, facilities, and third parties support a service, you can group their signals into a service-level view. A database slowdown is then no longer just an infrastructure event. It is an early warning for every important business service that relies on that database.
3. Interpret against thresholds and tolerances
Signals need context to become insight. Effective programs define layered thresholds:
- Operational thresholds that prompt technical teams to investigate.
- Early warning thresholds, tied to KRIs and risk appetite, that prompt risk owners and service owners to pay attention.
- Escalation thresholds that indicate a service may be approaching its impact tolerance and that leadership decisions may be needed.
Trends often matter more than single readings. A gradual rise in error rates, a steady growth in a processing backlog, or repeated short outages at a provider can signal emerging risk long before any single alert would. Analytics and correlation help separate meaningful patterns from noise, but they should always be explainable to the people who must act on them.
4. Act before disruption escalates
Insight without action has little value. Each threshold should be linked to a defined response: investigate, apply a workaround, reroute traffic, fail over, activate a continuity plan, engage a provider, or convene a crisis team. Predefined playbooks and clear decision rights allow teams to act quickly and consistently, and every action should be recorded so that it can be reviewed and improved.
Consider an illustrative example. A payment service relies on a third-party fraud screening provider. Response times from that provider begin to climb slowly over several hours. No single alert fires, but the service-level view shows a rising trend and a growing queue of pending payments. Because a threshold is linked to a playbook, the service owner switches to a documented fallback process and engages the provider before customers see failed transactions.
What organizations should do
Building telemetry for proactive resilience does not require replacing existing tools. It requires connecting them to business priorities. A practical approach:
- Start with your important business services. Confirm which services matter most, their impact tolerances, and the dependencies that support them. Telemetry should follow this structure.
- Inventory your existing signals. Identify what monitoring, logging, security, business, and third-party data you already collect, who owns it, and where it is stored. Note gaps for each important service.
- Define service health indicators and KRIs. For each important service, agree a small set of indicators that show health and emerging risk, and link KRIs to your risk appetite statements.
- Set layered thresholds. Establish operational, early warning, and escalation thresholds, with escalation levels calibrated against impact tolerances.
- Bring third parties into view. Use contractual terms, status feeds, and regular reporting to include critical providers' health in your service-level picture.
- Link signals to playbooks and decision rights. Document who is alerted at each threshold, what they are expected to do, and who has authority to make major decisions.
- Build an executive view. Give leaders a concise, service-based view of health, trends, and items approaching tolerance, rather than raw technical dashboards.
- Test the detection, not just the recovery. Use scenario exercises to check whether signals are detected, escalated, and acted on in time. DORA, for example, requires that detection mechanisms be regularly tested.
- Review and refine. After incidents, near misses, and exercises, ask which signals gave early warning, which were missed, and which thresholds need adjustment.
Leadership considerations
Telemetry is often treated as a technical concern, but its value depends on leadership choices.
- Ask service questions, not system questions. Executives and boards should expect reporting that shows whether important business services are within tolerance and how risk is trending.
- Define what "early" means. Leaders should agree how much warning they need to make key decisions, such as invoking a continuity plan or notifying customers, and make sure thresholds provide it.
- Fund the connection, not just the tools. The most important investment is often in mapping, ownership, and process that link existing data to business services.
- Balance automation and judgment. Automated detection and response can speed action, but significant decisions affecting customers, regulators, or markets should have clear human accountability.
- Govern the data. Telemetry can include personal data, security information, and commercially sensitive details. Access, retention, and privacy obligations should be addressed from the start.
- Use telemetry as evidence. Well-governed telemetry can help demonstrate to auditors, regulators, and boards that monitoring is in place and working, and that the organization learns from what it sees.
How OpResONE can help
OpResONE helps organizations turn operational data into resilience insight that leaders can act on. Our advisory support includes:
- Signal and KRI framework design: defining service health indicators, key risk indicators, and layered thresholds linked to risk appetite and impact tolerances.
- Service and dependency mapping: connecting telemetry sources to important business services, their dependencies, and critical third parties.
- Escalation and decision design: linking thresholds to playbooks, decision rights, and crisis management arrangements.
- Detection-focused exercises: scenario testing that checks whether early warnings are seen, escalated, and acted on in time.
- GRC integration through partner platforms: as an Authorized SwissGRC Channel Partner for the United States and Canada, OpResONE helps organizations bring resilience indicators, risk data, and evidence into an integrated governance, risk, and compliance view.
OpResONE combines advisory expertise with technology platforms so that resilience programs are built on live insight rather than static documents. We bring BRILLIANCE to RESILIENCE®.
Related resources
- Technology Platforms overview
- Operational Resilience advisory services
- Operational Resilience: Where to Start
- Mapping Dependencies Before Disruption
- Beyond Due Diligence: Proving Third-Party Resilience
Request a demo
If your teams collect large amounts of operational data but leaders still learn about disruption too late, it may be time to connect your signals to the services that matter. Request a demo to see how a partner GRC platform can bring resilience indicators and evidence into one view, or start with a strategy call to discuss your important business services, KRIs, and early warning needs.
Sources
- ISO 22301:2019, Security and resilience — Business continuity management systems — Requirements
- NIST, The NIST Cybersecurity Framework (CSF) 2.0, CSWP 29 (February 26, 2024)
- Regulation (EU) 2022/2554 (Digital Operational Resilience Act), Articles 10 and 17, EUR-Lex
- Bank of England / PRA, SS1/21 "Operational resilience: Impact tolerances for important business services" (March 2021)
- OpenTelemetry, "Signals" (OpenTelemetry documentation)
- Google, Site Reliability Engineering, Chapter 6 "Monitoring Distributed Systems" (four golden signals)


